Blog
How Neon Signs Attract Customers: The Evidence
Every storefront claim should survive the question “how, exactly?” — and neon’s answer is better documented than most small-business marketing spends, because the medium has been running the same experiment on the same streets for a century. This is the mechanism piece: what neon actually does to passing attention, why the glow outperforms the static, and where the returns show up in a business’s numbers.
The purchase-decision tier lives at the small business playbook; the placement physics at the open sign guide.
Mechanism One: Capture
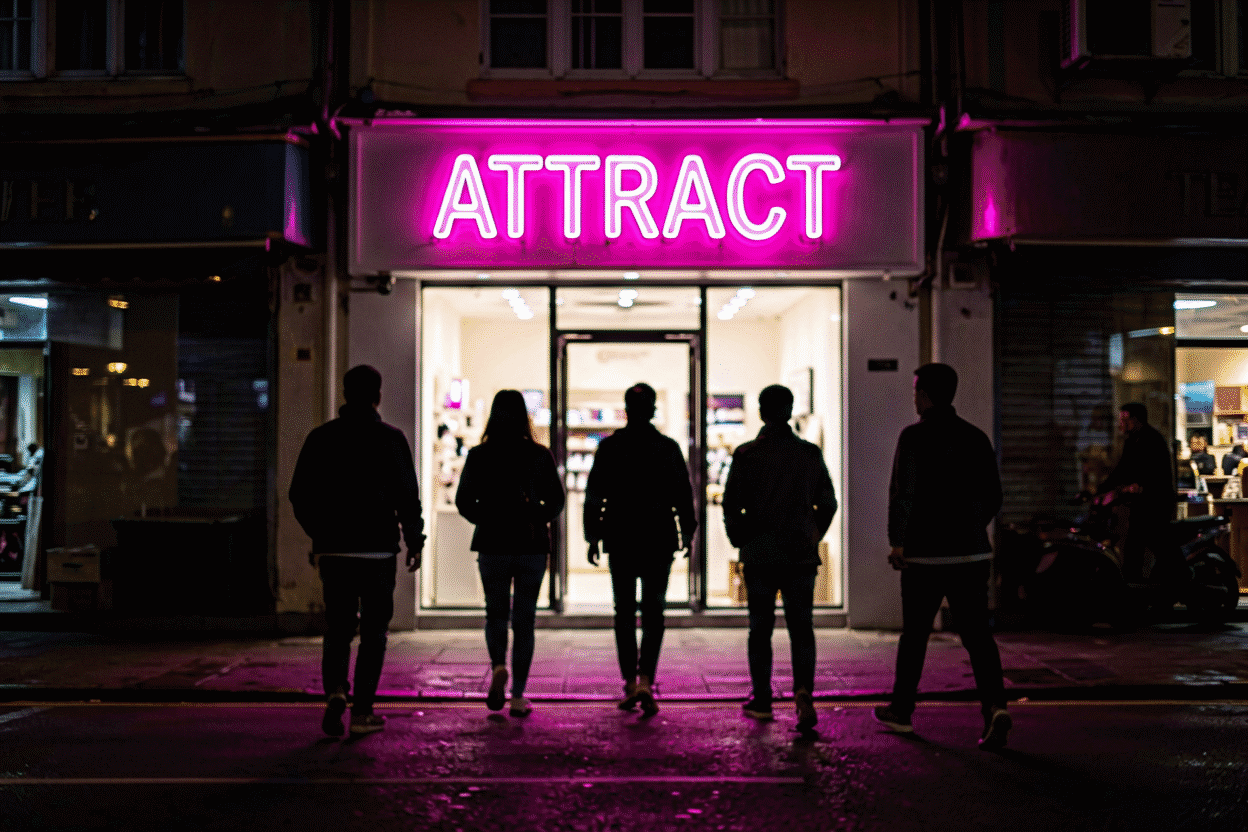
The passerby’s attention is a scarce resource allocated in fractions of a second, and glow captures it by physics: luminance contrast. The human visual system prioritizes the brightest contrast in the field — the reason the glowing sign is seen from across the street while the matte sign beside it disappears. This isn’t nostalgia or aesthetics; it’s how the eye works, and it’s why the sign that outglows its block outpulls its block (the storefront logic).
The capture math runs by street type: pedestrian traffic gives each storefront 2–3 seconds of attention; arterial traffic gives less than one. The sign’s job in that window is legibility plus interest — “OPEN” plus something that suggests worth entering. The businesses that measure walk-in baselines before and after a sign upgrade (the playbook’s discipline) are consistently measuring the same thing: the glow converts a share of the traffic the rent already paid for.
Mechanism Two: Information
Neon’s second job is status signaling — the “open” that saves the customer from the awkward door-pull, the hours that prevent the wasted trip, the “COLD BEER” that answers the exact question the walker has. The information tier is why the honest sign (the guide’s rules) outperforms the decorative one: the sign that reliably tells the truth gets consulted, and the consulted sign gets followed.
The trade tier extends the information: the cup says coffee, the slice says pizza, the scissors say the walk-in’s welcome (the industry canon through the trades). Signage studies going back decades (the classic Small Business Administration-era work on storefront visibility, echoed in every modern retail-audit line since) converge on the same hierarchy: businesses with clear, legible, lit signage outperform comparable businesses without, and the effect concentrates in impulse and walk-in traffic — exactly the segments neon addresses.
Mechanism Three: Memory and the Content Era
The third mechanism is the modern one: the photographed wall. The customer who posts the room with your sign in it is running an unpaid endorsement to exactly the audience that trusts it most — their own network. The businesses with the “Instagram wall” (the retail case) discovered the compounding return: a $300 interior piece generating hundreds of organic posts, each one a referral no ad budget buys.

The memory tier works even unphotographed: the glowing storefront is the one the street recalls after dark, the landmark in directions (“next to the neon place”), and the anchor of the neighborhood’s mental map. Brand memory is repetition plus distinctiveness, and the glow supplies both at once — the same reason the big brands kept their neon for a century (the vintage archive is that history).
The Economics
The sign’s cost structure is why the mechanisms pencil: acquisition cost near zero per impression. A $200 open sign (the brackets) running on a few dollars of annual electricity (the math), lasting years (the lifespan guide), works every business hour — thousands of hours of street exposure for a one-time spend. No paid channel touches that cost-per-impression, which is why the sign survives every marketing-budget era as the baseline spend.
The honest limits: the sign converts existing traffic, it doesn’t create it (the dead-location store cannot sign its way to a crowd); the sign’s returns concentrate in walk-in-adjacent trades (food, beauty, retail, nightlife — the industries in the canon); and the lying sign destroys its own asset — the street that’s been fooled twice stops reading. Within those limits, the mechanism is as close to physical law as marketing gets.
Where the Returns Show Up
Four lines to watch (the playbook’s measurement discipline): walk-ins (the capture tier’s direct read — baseline before, count after), posts and tags (the content tier’s read), after-hours brand impressions (the glow’s night work — harder to count, easy to see), and repeat visits (the memory tier’s slow compounding). The businesses that see nothing usually bought art instead of infrastructure — the piece with no job and no audience (the fix).
The Evidence File: What We Know and How
The honest epistemics behind the three mechanisms: the capture physics (luminance contrast’s priority in visual attention) is textbook perception science – the eye’s allocation to brightness contrast is measured at the millisecond level, and the storefront application is the century’s accumulated practice evidence. the signage-performance correlation (businesses with clear, lit signage outperforming comparable businesses without, with effects concentrating in impulse and walk-in traffic) runs through decades of retail-audit literature – the SBA-era visibility studies through the modern trade-association surveys – all correlational, all directionally consistent, none proving causation for any individual business. The content-tier returns (the photographed wall’s organic-post engine) are the newest and least formally studied – the platform-era evidence is voluminous but anecdotal-by-structure, and the honest read is “the mechanism is real, the magnitude varies.”
What this means for the buyer: the sign’s case is strong, directionally consistent, and individual-results-vary – the same epistemics as any marketing channel, with better cost structure than most (the economics). The program that measures its own baseline and counts (the discipline) replaces the literature’s correlation with the business’s own data – the only evidence that actually decides the next quarter’s budget.
The Counter-Case: When Neon Doesn’t Work
The honest limits, stated as failures to avoid: the dead-location store (the sign converts existing traffic; it doesn’t create traffic that isn’t there – the sign on the empty street glows for nobody). The register mismatch (the novelty piece on the trust trade – the sign that costs credibility rather than building it, the palette logic). The lying sign (the “open” that isn’t – the asset destroyed by its own dishonesty). The unmeasured program (the sign that’s working but gets no credit, and the budget that goes elsewhere while the walk-ins quietly compound). The art-first purchase (the beautiful piece with no job on a wall with no audience – the decoration the business can’t afford).
The counter-case’s lesson: the sign is an amplifier, not a generator – it amplifies the traffic, the brand, and the room that exist, and the business that has none of the three has a problem no sign solves (the playbook for the foundations first).
FAQ About Neon Signs and Customers
Do neon signs actually attract customers? By three mechanisms — luminance capture, honest status information, and the photographed-wall memory tier (the case above). The capture and information tiers convert existing street traffic; no sign creates traffic that isn’t there.
Why do neon signs work better than regular signs? Luminance contrast: the eye prioritizes the brightest element in the field, so the lit sign outreads the matte one at every distance and after dark — the physics the century of storefronts converged on.
What’s the ROI on a business neon sign? The cost structure is the answer: a $100–300 piece, pennies of power (the math), years of every-business-hour exposure (the lifespan) — the cheapest impressions the business will ever buy, concentrated in walk-in conversion.
Which businesses benefit most? The walk-in trades — food, beauty, retail, nightlife, services (the industry canon) — where street traffic is the customer base and the photographable wall compounds it.
Do neon signs really increase business? By three mechanisms with real evidence: luminance capture (the eye’s physics – the glow that stops the passerby), honest status information (the open sign that converts the stopped), and the photographed-wall content tier (the customer’s post as the unpaid endorsement) (the full case). The effects concentrate in the walk-in trades (food, beauty, retail, nightlife) and the honest limits are real (the sign converts existing traffic; it doesn’t create it). The business that wants its own answer runs the baseline-and-count discipline (the measurement) – the only evidence that actually decides the next budget.
How much does a business neon sign cost per year to run? The LED tier: a few dollars of electricity annually (the math) – the open sign at business hours, the interior pieces at their evening schedules, the whole program drawing less than the shop’s refrigerator. The glass tier: tens of dollars (the higher draw) plus the periodic maintenance (the transformer’s years). The annual cost-per-impression that results: the sign working ten hours a day, six days a week, fifty weeks a year produces hundreds of thousands of street impressions for the price of a coffee – the marketing channel no paid platform approaches (the economics).
What’s a realistic first-month return on a storefront neon piece? Owners who track walk-in sources typically see the sign paying its rent in photos before sales — the piece enters customers’ camera rolls and the map app’s photo feed, and the walk-in bump follows over weeks. A $350-500 storefront script that moves walk-ins up even two covers a night breaks even inside a quarter; the honest range is slow compounding, not week-one fireworks.
Which trades get the least lift from neon signage? Purely appointment-based trades with no street presence — accountants, therapists, B2B consultants — buy glow for the office lobby’s mood, not for customer acquisition, and should budget accordingly. The high-lift category is the opposite profile: impulse stops, evening hours, and foot traffic, which is why ice cream shops and bars have anchored the medium for seventy years.
Sources & Further Reading
- Solid-State Lighting (U.S. Department of Energy) — DOE reference on LED efficacy and lifetime.
- Neon sign (Wikipedia) — the consolidated public record of neon-sign history and technology.
- Mercury (U.S. EPA) — federal guidance on mercury exposure and safe handling.
Pricing based on CustomNeon’s current catalog (2026); custom quotes come live from the sign builder.